AI Reporting & Dashboards: Stop Guessing, Start Deciding
the spreadsheet trap
You know the feeling. Month ends, you open the spreadsheet, and somehow the numbers don't match what you remember happening. Maybe a formula broke. Maybe someone typed over a cell. Maybe the file was version_final_v3_REAL this time.
Spreadsheets aren't the problem — it's that they were never built for running a business in real time. They're snapshots. By the time you finish building a report, the data's already old. And honestly? Most small business owners don't open them after the first week.
The real cost isn't the time you spend building reports. It's the decisions you make without data because the data was too painful to gather.
what AI dashboards actually do
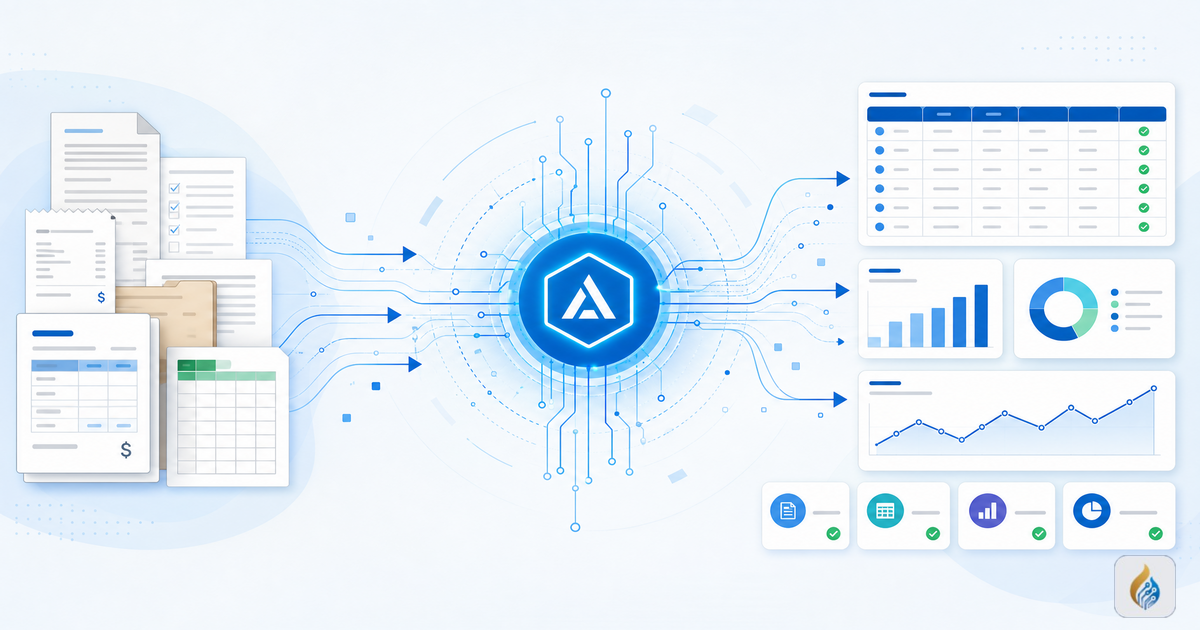
Here's the shift: instead of you going to the data, the data comes to you.
An AI-powered reporting dashboard connects to the systems you already use — your CRM, invoicing platform, inventory tracker, ad accounts — and pulls everything into one place. It updates automatically. No manual imports, no copy-pasting between tabs.
But the real value isn't aggregation. It's focus. A good dashboard doesn't give you fifty charts. It gives you the five numbers that actually drive your business — revenue trend, cash runway, customer acquisition cost, margins, and the one anomaly that needs attention today.
That's what AI does well. It cuts through the noise and surfaces what matters.
the ROI is real
Let's do the math. If you spend 3–5 hours a week manually pulling reports — and most small business owners we talk to spend at least that — you're burning 150 to 260 hours a year on data wrangling.
At $50/hour of your time, that's $7,500 to $13,000 a year in recovered capacity.
But the bigger number is what happens when you catch problems early. A cash flow dip caught in week two instead of week eight. A margin erosion flagged before it eats your quarter. A customer segment trending down that you can act on now instead of guessing about later.
Faster decisions from better data aren't a nice-to-have. They're the difference between a business that steers and one that drifts.
from reactive to proactive
Traditional reports answer one question: "What happened last month?"
That's useful, but it's rearview mirror stuff. AI dashboards answer a different question: "What should I pay attention to right now?"
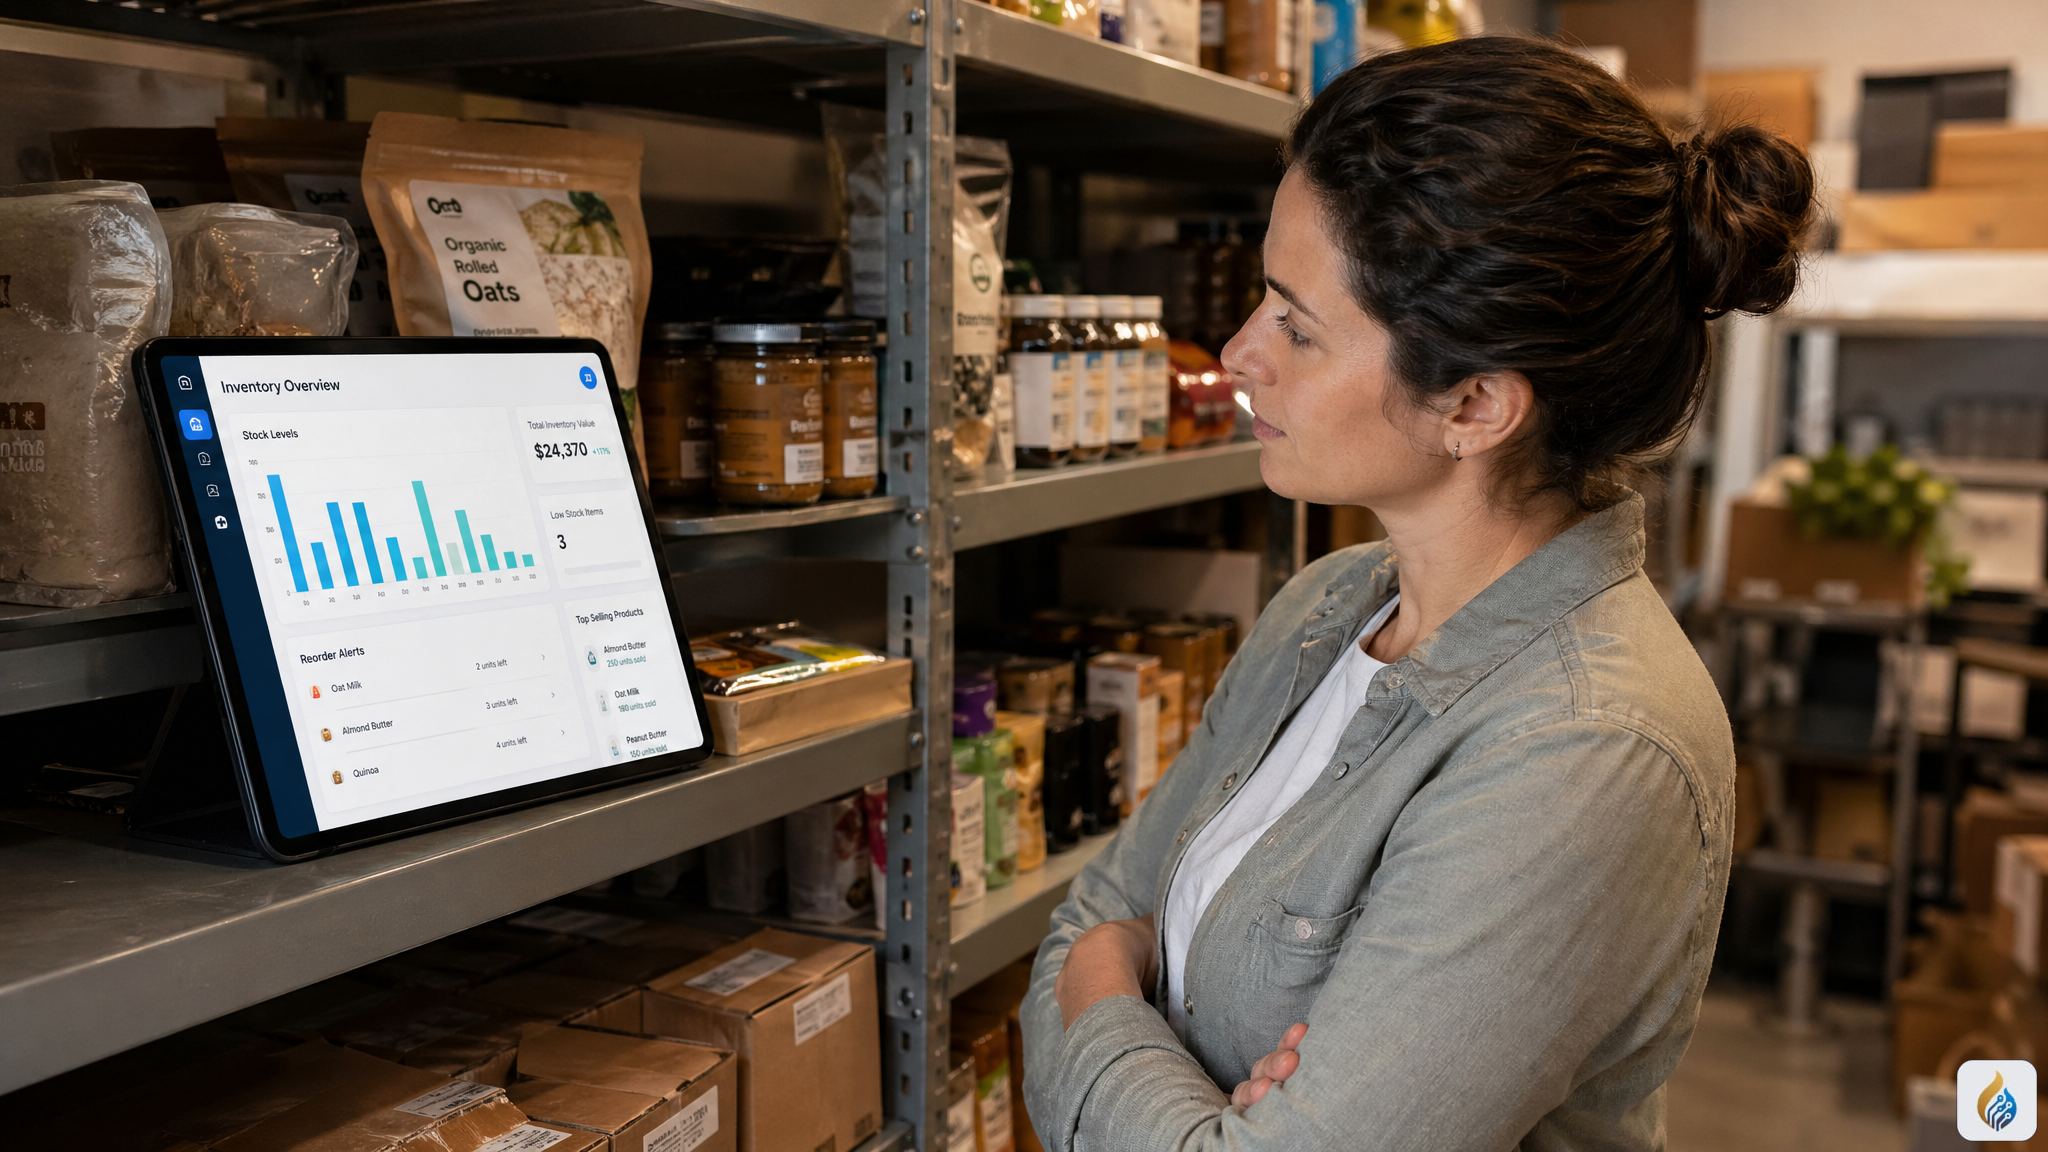
Anomaly detection flags when something's off — a sudden drop in conversion, an unexpected spike in returns, a supplier invoice that doesn't match the pattern. Trend analysis shows you where things are heading, not just where they've been. And pattern recognition surfaces opportunities you'd miss scanning rows in a spreadsheet.
The shift is from "What happened?" to "What do I do next?" That's the difference between a report and a decision engine.
we build this for you
Here's where we come in. You don't need to learn a BI platform. You don't need to figure out data pipelines or write SQL or configure alerts.
Aurumflare sets up AI-powered reporting dashboards tailored to your business. We connect your systems, choose the metrics that actually matter for your industry and stage, and hand you a dashboard that updates itself. You just open it, see what needs attention, and make the call.
No implementation headaches. No "tool evaluation" phase. Just a working system that turns your business data into decisions.
See what your business data is trying to tell you. We'll set up your dashboard — you just make the decisions. [Get started at aurumflare.com/contact](https://aurumflare.com/contact)
---
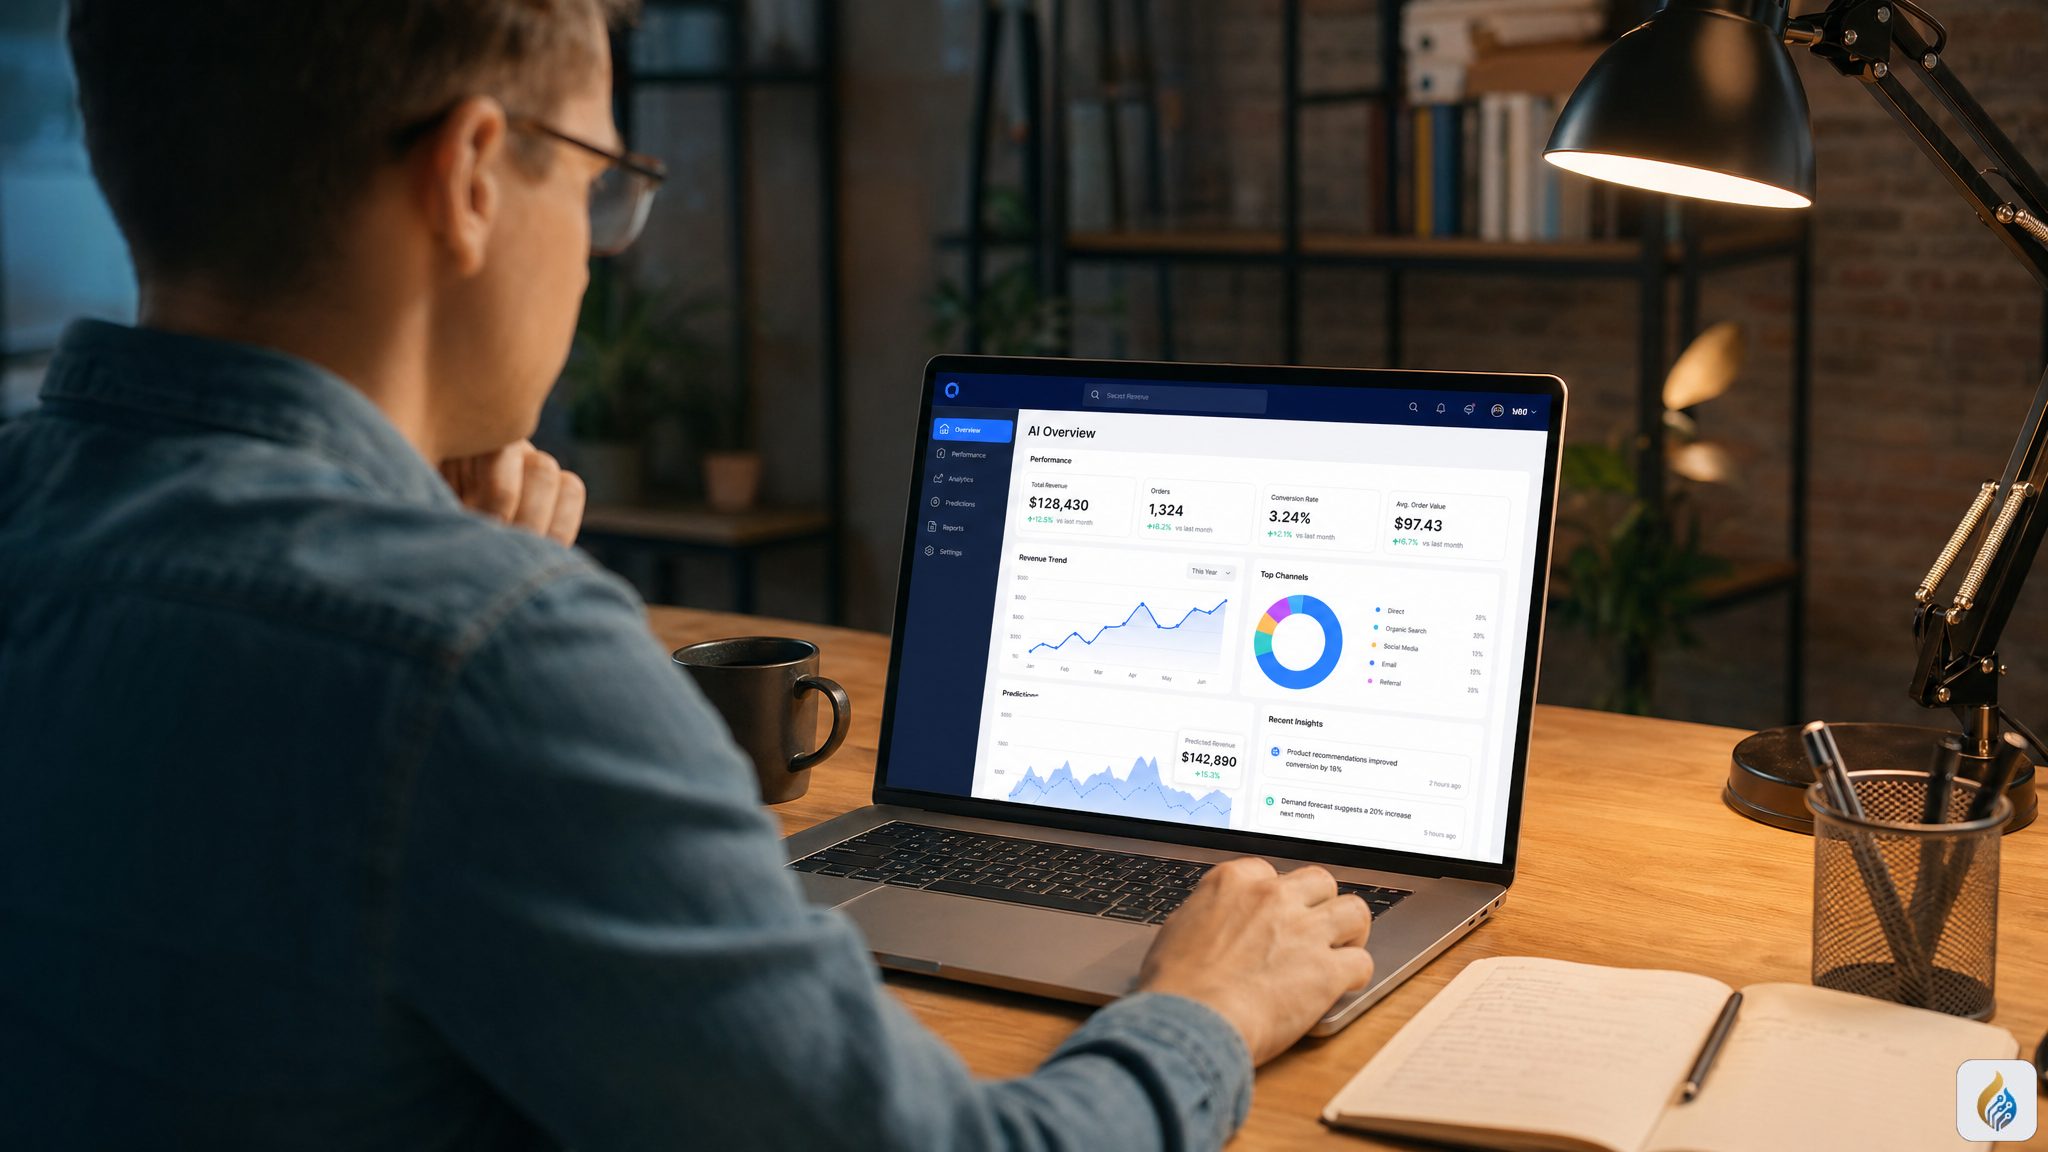
Image prompt: Photorealistic scene of a small business owner sitting at a warm wooden desk in a modern office, looking at a laptop screen showing a clean AI dashboard with clear charts and KPI metrics. Blue and cyan accent colors on a dark navy header bar. Warm ambient lighting from a desk lamp. Coffee mug nearby. Professional but approachable atmosphere.
See how AI automation could work for your business
Book a free 30-minute assessment — no pitch, just answers.
Book a Free Assessment